How to Calculate Utilization for an Engineering or Architecture Firm
Utilization is billable hours divided by available hours. Most firms target 60–65% firm-wide — but that number only means something when you know the role mix, the denominator, and the multiplier sitting next to it.
Jonathan Sharp, PE, CPHC
Co-Founder & CEO, Excede
Jonathan is a licensed Professional Engineer with 15 years of MEP experience and is currently Engineer of Record on active institutional and hospitality projects in New York.
Utilization is billable hours divided by available hours. Healthy architecture and engineering firms typically land around 60–65% firm-wide — but production staff should be closer to 85–90%, principals closer to 30–50%, and none of those numbers mean much until you read them next to your net multiplier.
That's the whole answer. The rest of this post is about the three ways firms get the number wrong: they pick the wrong denominator, they compare the wrong role, and they treat a high utilization number as good news on its own.
I've been an MEP engineer for fifteen years, most of it at firms in the 10-to-100-person range, and I now run one. Utilization is the metric principals argue about most, and the argument is almost always about the math underneath — not the people.
The formula
Utilization = Billable Hours ÷ Available Hours
Billable hours are hours charged to client projects — work that can become revenue. Not proposal time, not admin, not internal meetings, not "quick" drawing cleanup that never makes it onto an invoice.
Available hours is where the fight starts. Some firms use a standard week (typically 40 hours). Others use actual hours worked. Same person, same week, different number — and both camps will tell you the other is lying.
Same week, measured two ways
One engineer. Fifty hours worked. Forty charged to projects.
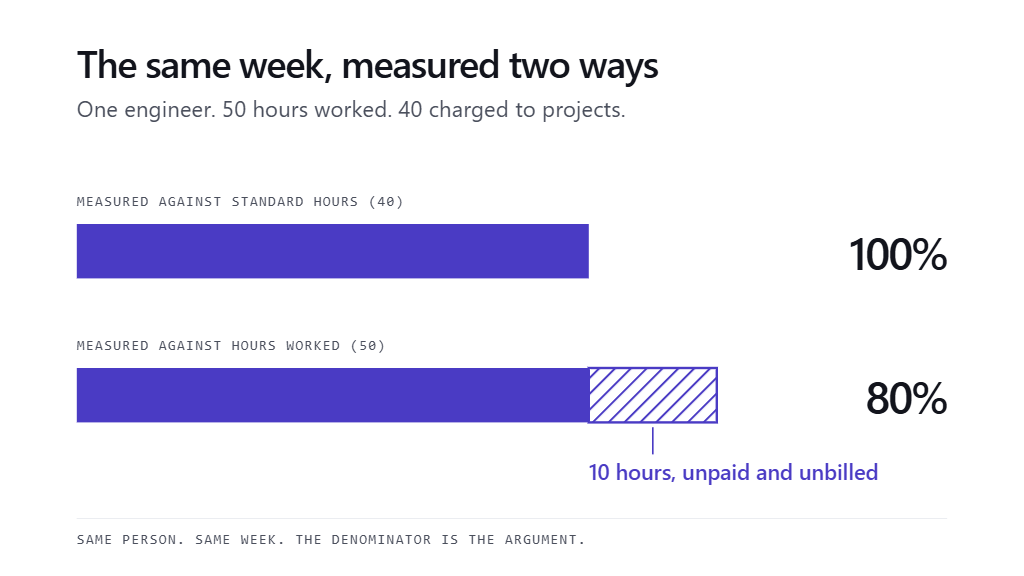
Measured against a 40-hour standard week: 100%. Measured against the 50 hours she actually worked: 80%. The ten-hour gap is unpaid and unbilled — overtime the firm absorbed, not capacity the firm sold.
Neither answer is wrong. They answer different questions.
- Standard-hours utilization asks: how much of a full-time seat did we sell?
- Hours-worked utilization asks: how much of what people actually did was billable?
If your timesheets systematically under-report total hours worked, the standard-hours version quietly inflates. If people regularly work past 40 and you refuse to count it, the hours-worked version looks worse than the firm feels. Pick one definition, write it down, and stop changing it mid-year when the number disappoints.
Target utilization by role
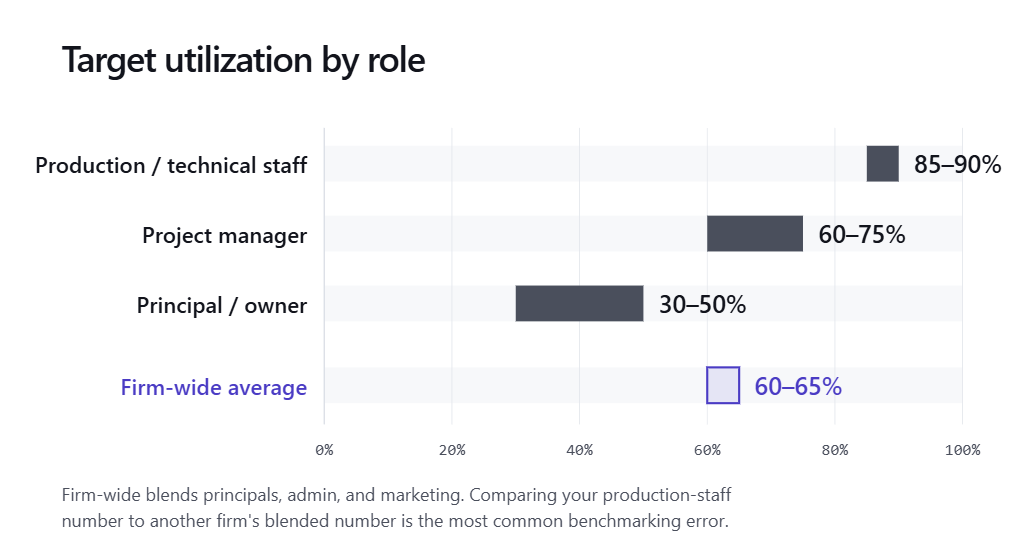
Firm-wide averages hide the real picture. Targets should drop as seniority and non-billable responsibility climb.
| Role | Target range |
|---|---|
| Production / technical staff | 85–90% |
| Project manager | 60–75% |
| Principal / owner | 30–50% |
| Firm-wide average | 60–65% |
A principal at 80% utilization is not a hero. That person is either not doing the BD, mentoring, and client work the role requires — or the firm is understaffed and burning its rainmakers as production labor. A junior engineer at 55% is the opposite problem: idle capacity you are paying for.
The firm-wide number blends principals, admin, and marketing. Comparing your production-staff number to another firm's blended number is the most common benchmarking error. If someone quotes "industry average utilization of 65%" without saying whether that is firm-wide or technical staff only, discard the comparison.
Utilization and multiplier only mean something together
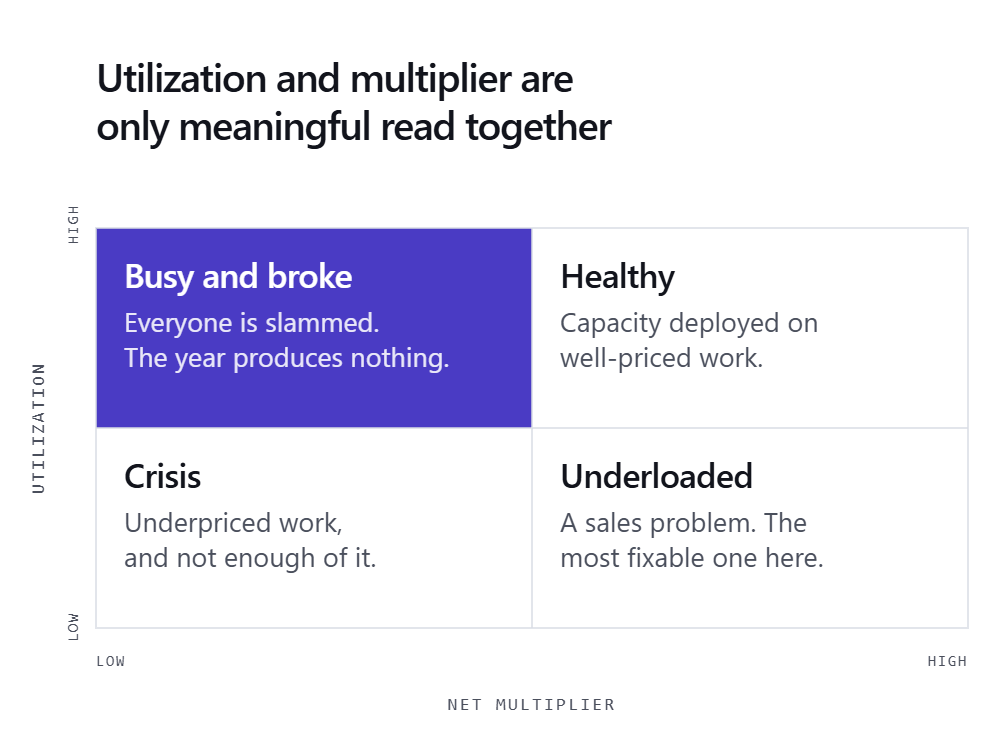
A high utilization rate with a weak net multiplier is not a healthy firm. It is a busy one that is not making money.
| Low net multiplier | High net multiplier | |
|---|---|---|
| High utilization | Busy and broke — everyone is slammed; the year produces nothing | Healthy — capacity deployed on well-priced work |
| Low utilization | Crisis — underpriced work, and not enough of it | Underloaded — a sales problem; the most fixable one here |
This is the frame I wish more principals used in monthly ops reviews. Utilization alone answers "are we busy." Multiplier alone answers "are we priced." The quadrant answers "are we building a firm that works."
The trap most firms fall into is the top-left cell. Utilization looks great on the dashboard. People are tired. Revenue feels busy. Then year-end profit is thin or gone, and nobody can explain why — because nobody put the two numbers on the same page.
Underloaded (bottom-right) feels worse culturally and is usually easier to fix: sell more work, or right-size capacity. Busy and broke requires harder surgery — scope discipline, staffing mix, rate realization — the same levers that fix a low multiplier.
What to do with the number
Three habits that keep utilization useful instead of theatrical:
1. Report by role band, not only firm-wide. Keep the firm-wide average for trend. Manage the production, PM, and principal bands separately. One blended number invites the wrong hire.
2. Freeze the denominator. Standard hours or hours worked — choose, document, and stick. If you change it, restate prior periods so you are not celebrating a definition change.
3. Pair it with multiplier every month. Put utilization and net multiplier on the same slide. If utilization is up and multiplier is down, you did not have a good month. You had a busy one.