What Is a Good Overhead Rate for an Engineering or Architecture Firm?
Overhead rate is indirect expenses divided by direct labor. Most A/E firms run 1.4–1.8. Here's what it's actually made of, why you can't cut your way out of a bad one, and how it sets your break-even multiplier.
Jonathan Sharp, PE, CPHC
Co-Founder & CEO, Excede
Jonathan is a licensed Professional Engineer with 15 years of MEP experience and is currently Engineer of Record on active institutional and hospitality projects in New York.
Overhead rate is your total indirect expenses divided by your direct labor. Most architecture and engineering firms run between 1.4 and 1.8. Below 1.3 is unusual and worth verifying before you celebrate it. Above 2.0, your break-even multiplier is high enough that work priced at industry-standard rates loses money.
That last sentence is the reason this metric matters. Overhead rate isn't a cost-control statistic. It's the number that determines what you have to charge.
The formula
Overhead Rate = Total Indirect Expenses ÷ Direct Labor
Direct labor is the raw salary cost of hours charged to projects. Same denominator as net multiplier and utilization — that's not a coincidence, and we'll come back to it.
Indirect expenses are everything else the firm spends to stay open: non-billable staff time, fringe benefits, rent, insurance, software, marketing, admin salaries, professional dues, continuing education.
Stated as a ratio, 1.6 means that for every dollar of direct labor you book, the firm spends another $1.60 keeping the lights on and the people employed.
Where overhead actually goes
Here's the part that changes how you should think about fixing it.
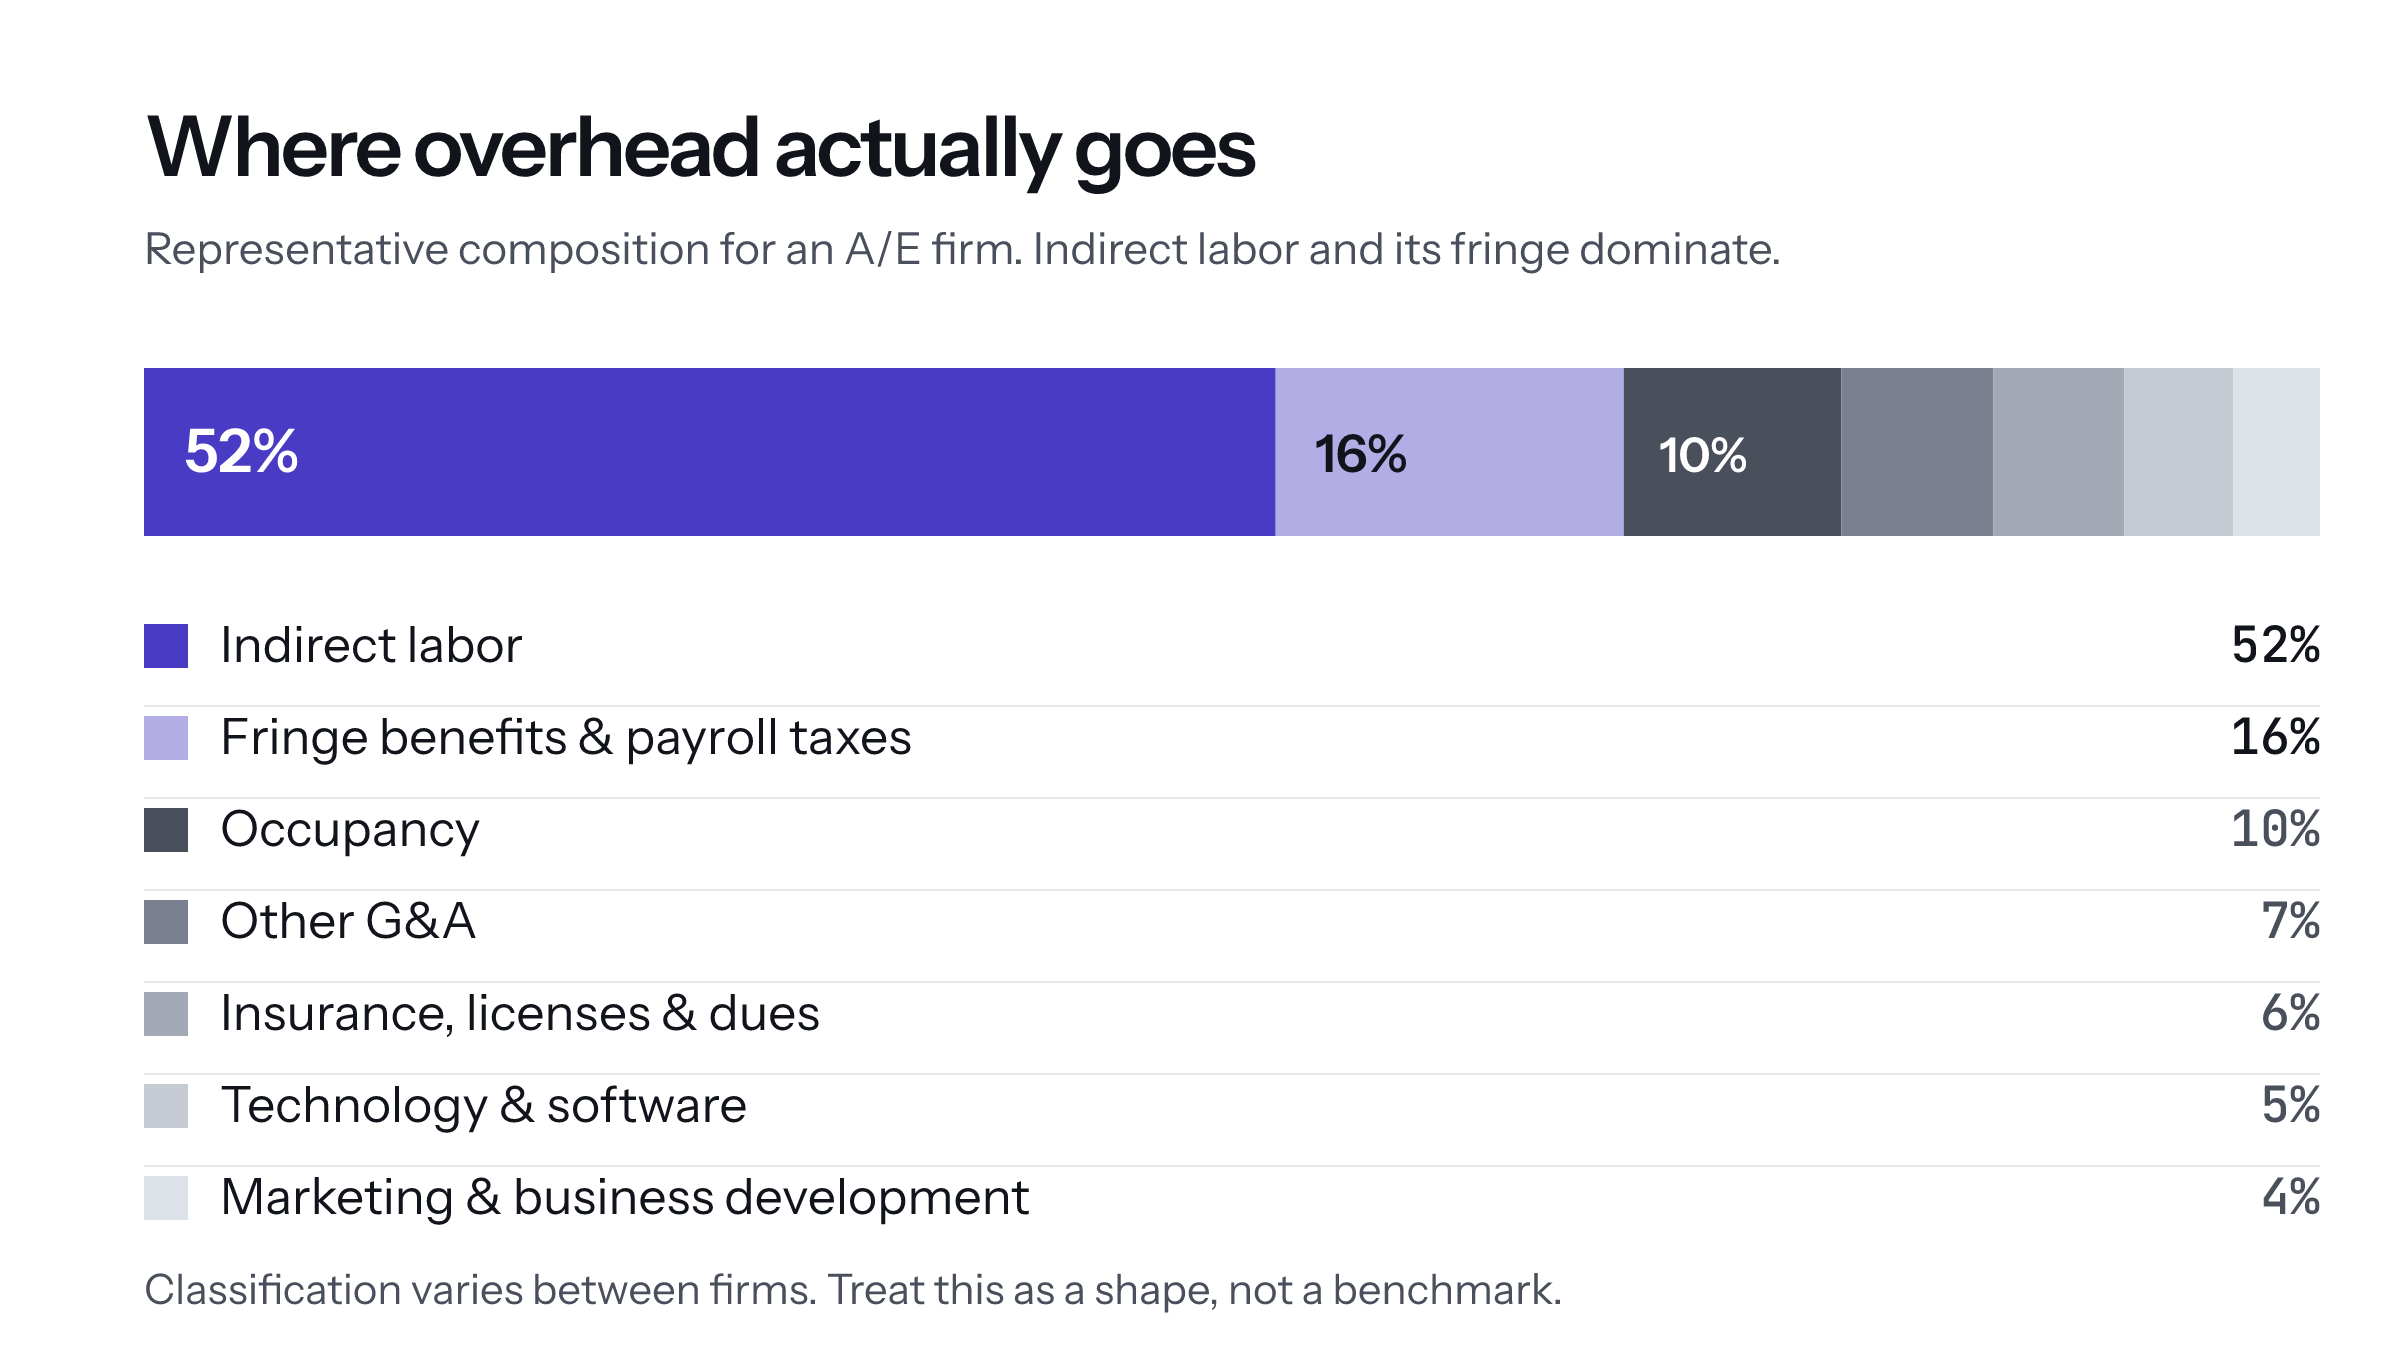
Indirect labor — time your people spend on anything not charged to a project — is usually the single largest component by a wide margin. Add the fringe and payroll taxes riding on top of it and you're at roughly two-thirds of total overhead before you've paid a single month of rent.
Classification varies between firms, so treat the shape as representative rather than precise. Run it against your own P&L before you use it for anything.
You cannot cut your way out of a bad overhead rate
This is the mistake I see most often, and it's an expensive one because it feels so responsible.
A firm notices its overhead rate climbing. The response is to go after the line items that are easy to see and easy to cancel: audit the software subscriptions, renegotiate the lease, cut the conference budget, push back on the insurance renewal. Call it a 15% reduction across technology, occupancy, and marketing — an aggressive year of cost discipline.
Against the composition above, those three categories total 19% of overhead. A 15% cut to 19% of the number moves your overhead rate by under three points. A 1.70 becomes a 1.67.
Meanwhile the two-thirds of overhead sitting in indirect labor went untouched, because nobody thinks of a half-empty week as a cost. It is one. It's the biggest one you have.
That's not an argument against running a tight shop. It's an argument that overhead rate is primarily a utilization problem wearing a cost mask, and that firms consistently attack it from the side where the leverage isn't.
Overhead rate sets your break-even multiplier
The direct consequence, and the reason this ties back to pricing:
Break-even Multiplier = 1.0 + Overhead Rate
Every dollar of direct labor has to cover itself plus its share of overhead before any of it is profit. Which means your overhead rate silently dictates what net multiplier you need to clear.
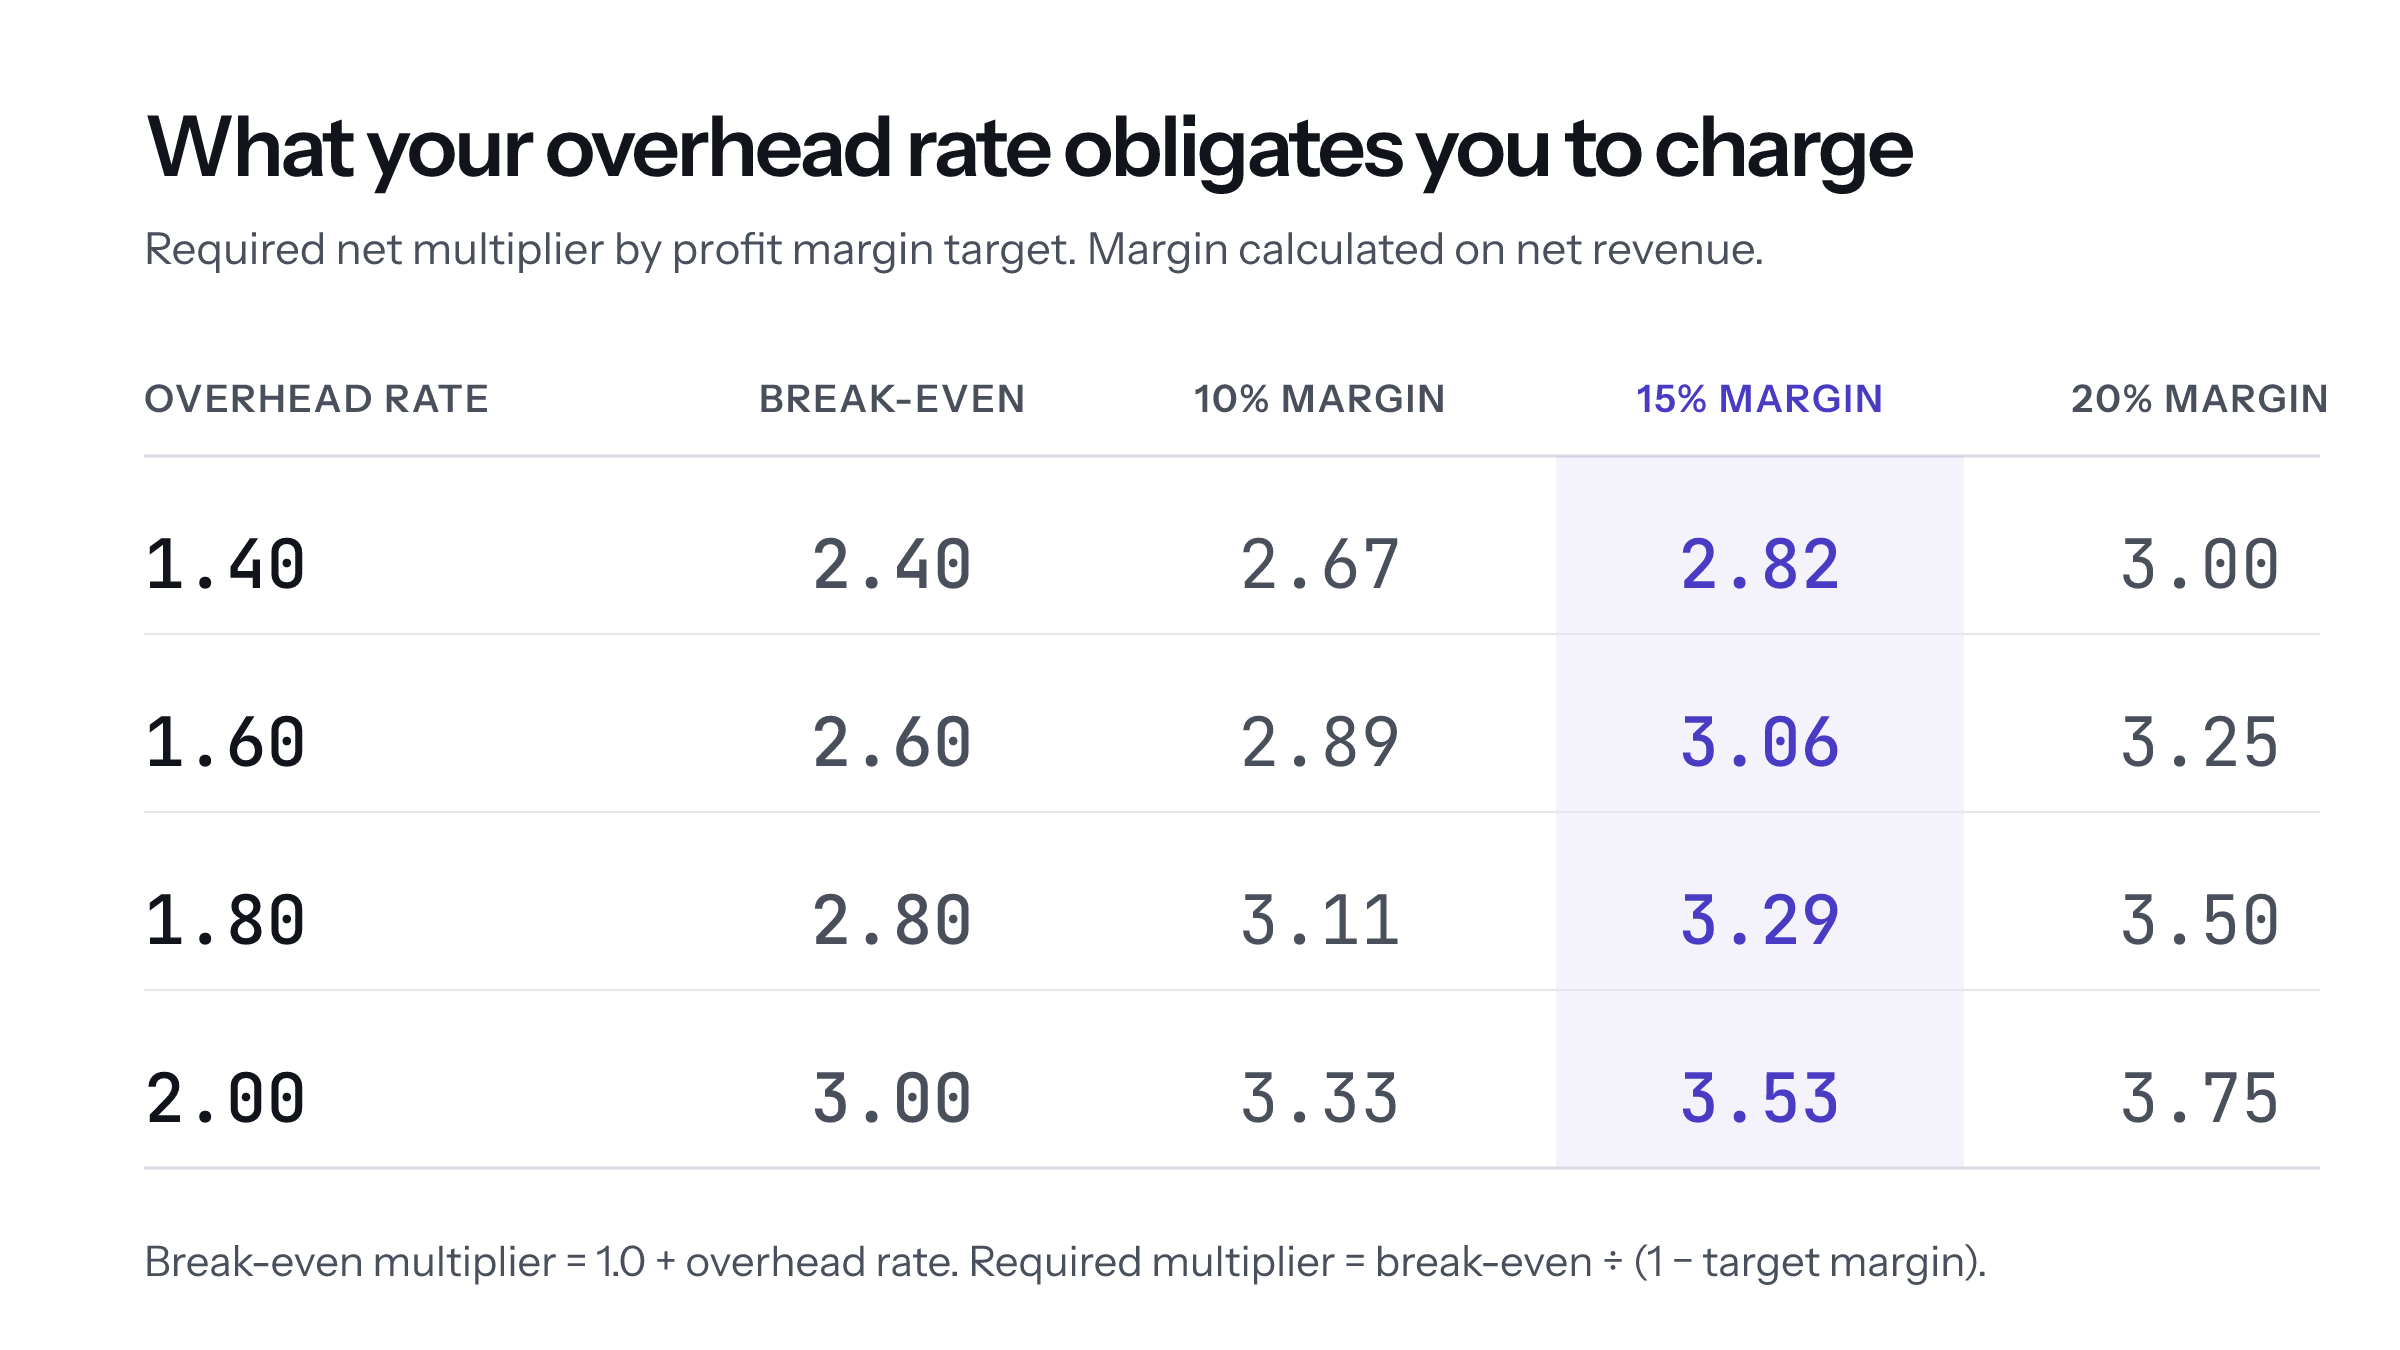
| Overhead rate | Break-even | 10% margin | 15% margin | 20% margin |
|---|---|---|---|---|
| 1.40 | 2.40 | 2.67 | 2.82 | 3.00 |
| 1.60 | 2.60 | 2.89 | 3.06 | 3.25 |
| 1.80 | 2.80 | 3.11 | 3.29 | 3.50 |
| 2.00 | 3.00 | 3.33 | 3.53 | 3.75 |
Read the 1.60 row and the conventional 3.0 target stops being folklore. It's approximately what a typical firm needs to clear a 20% margin. Read the 2.00 row and you can see the trap: a firm carrying that overhead needs a 3.53 multiplier to hit 15%, which is well above what most markets will bear. That firm does not have a pricing problem it can solve by raising rates. It has an overhead problem that has already removed pricing as an option.
The formula to work backward from a margin target:
Required Multiplier = Break-even Multiplier ÷ (1 − target margin)
Three metrics, one denominator
Here's the thing worth internalizing, and the reason these three numbers should never be read separately.
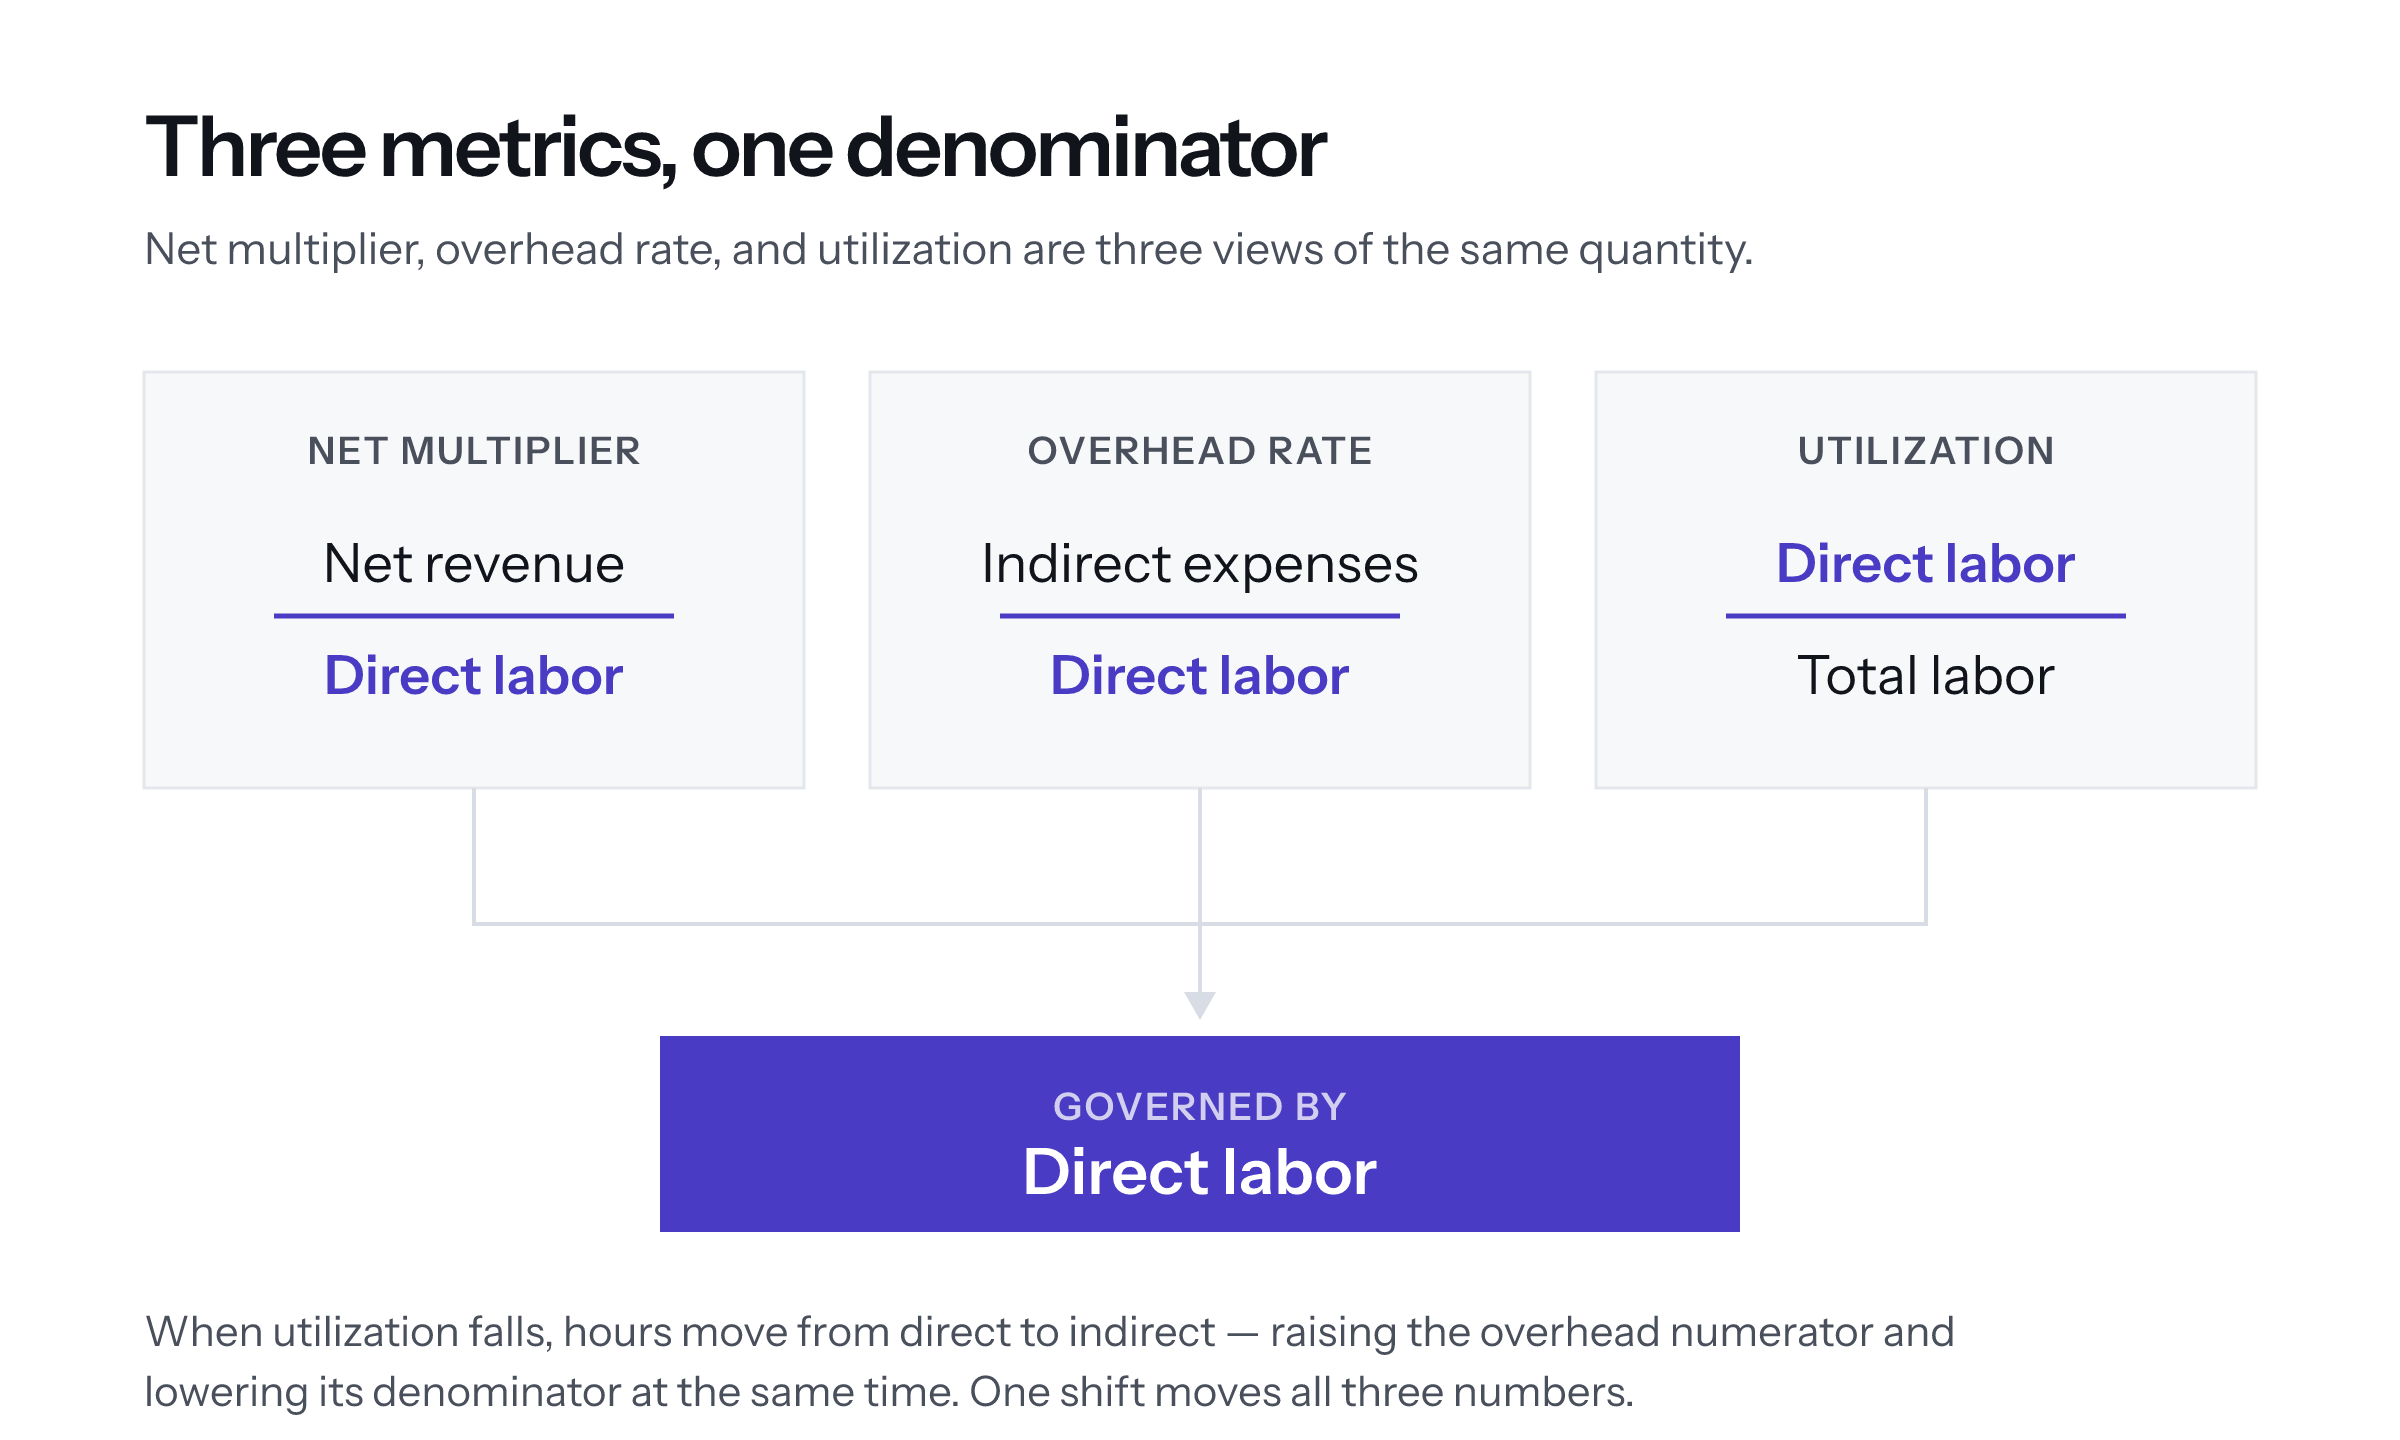
Net multiplier, overhead rate, and utilization all hinge on direct labor. They are not three independent dashboards. They are three angles on one question: how much of your payroll is doing recoverable work, and what are you getting for it.
This is why the metrics move together in ways that surprise people. When utilization falls, hours shift from direct to indirect — the overhead rate numerator rises while its denominator falls at the same time. A modest utilization decline produces a disproportionate jump in overhead rate, which raises your break-even multiplier, which means work you priced profitably in the spring is underwater by the fall. Nothing about your rates changed. Nothing about your costs changed. Your people just spent their time differently.
Any one of these numbers read alone will mislead you. Read together, they're close to a complete picture of firm health.
What to do with it
Calculate it quarterly at minimum. Monthly is better, but overhead rate is noisier month-to-month than utilization and a single bad month isn't a signal.
Decompose before you act. Pull the indirect labor component out separately. If it's growing faster than the rest, you have a utilization problem and cost-cutting will accomplish very little.
Compute your break-even multiplier and publish it internally. Your PMs should know the number their projects have to clear. Most don't, which is how firms end up with a portfolio of individually reasonable-looking projects that collectively lose money.
Audit your classifications once a year. Which is the next thing.
Your overhead rate is partly a definitional choice
Worth knowing before you benchmark yourself against anyone.
Firms draw the direct/indirect line differently. Some classify project management time as direct; others treat a portion as indirect. Some put fringe benefits in an overhead pool; others burden them into direct labor. Some capitalize software; others expense it.
None of these are wrong. But they produce meaningfully different overhead rates from identical underlying operations — which means a published benchmark is only comparable to your number if you know how the surveyed firms drew their lines, and you usually don't.
Pick a definition, document it, and hold it constant. Your trend against yourself is more informative than your position against a benchmark you can't fully interpret.